Test and debug in-app messages
UpdatedPreview, send test messages, and debug in-app messages on your website before you send them to a live audience. These features help you validate your integration and make sure your messages look and behave the way you want them to.
There are different ways to test your in-app messages:
- Live preview: Make sure your message looks the way you want it to by previewing it on your own website before you send it to your audience. From here, you can adjust display settings on the fly and see changes sync back to the editor automatically.
- Send a test message: Send a one-time test of your message to check that it shows up in the right place and behaves the way you expect. This is more of a “production” test, and a good way to verify your page rules before you send your message.
When a web message doesn’t show up when you expect it to, you can use the in-app SDK debugger to see the SDK’s live state on your own site. This can help you determine why your message doesn’t display and adjust your page rules or other settings.
| Send test | Live preview | |
|---|---|---|
| How it works | Sends a one-time test message | Opens an interactive session |
| Settings | Uses editor settings | Adjustable on the fly via preview bar |
| Platforms | Web and mobile | Web only |
| Duration | One-time | 30-minute session |
Preview your message on your website
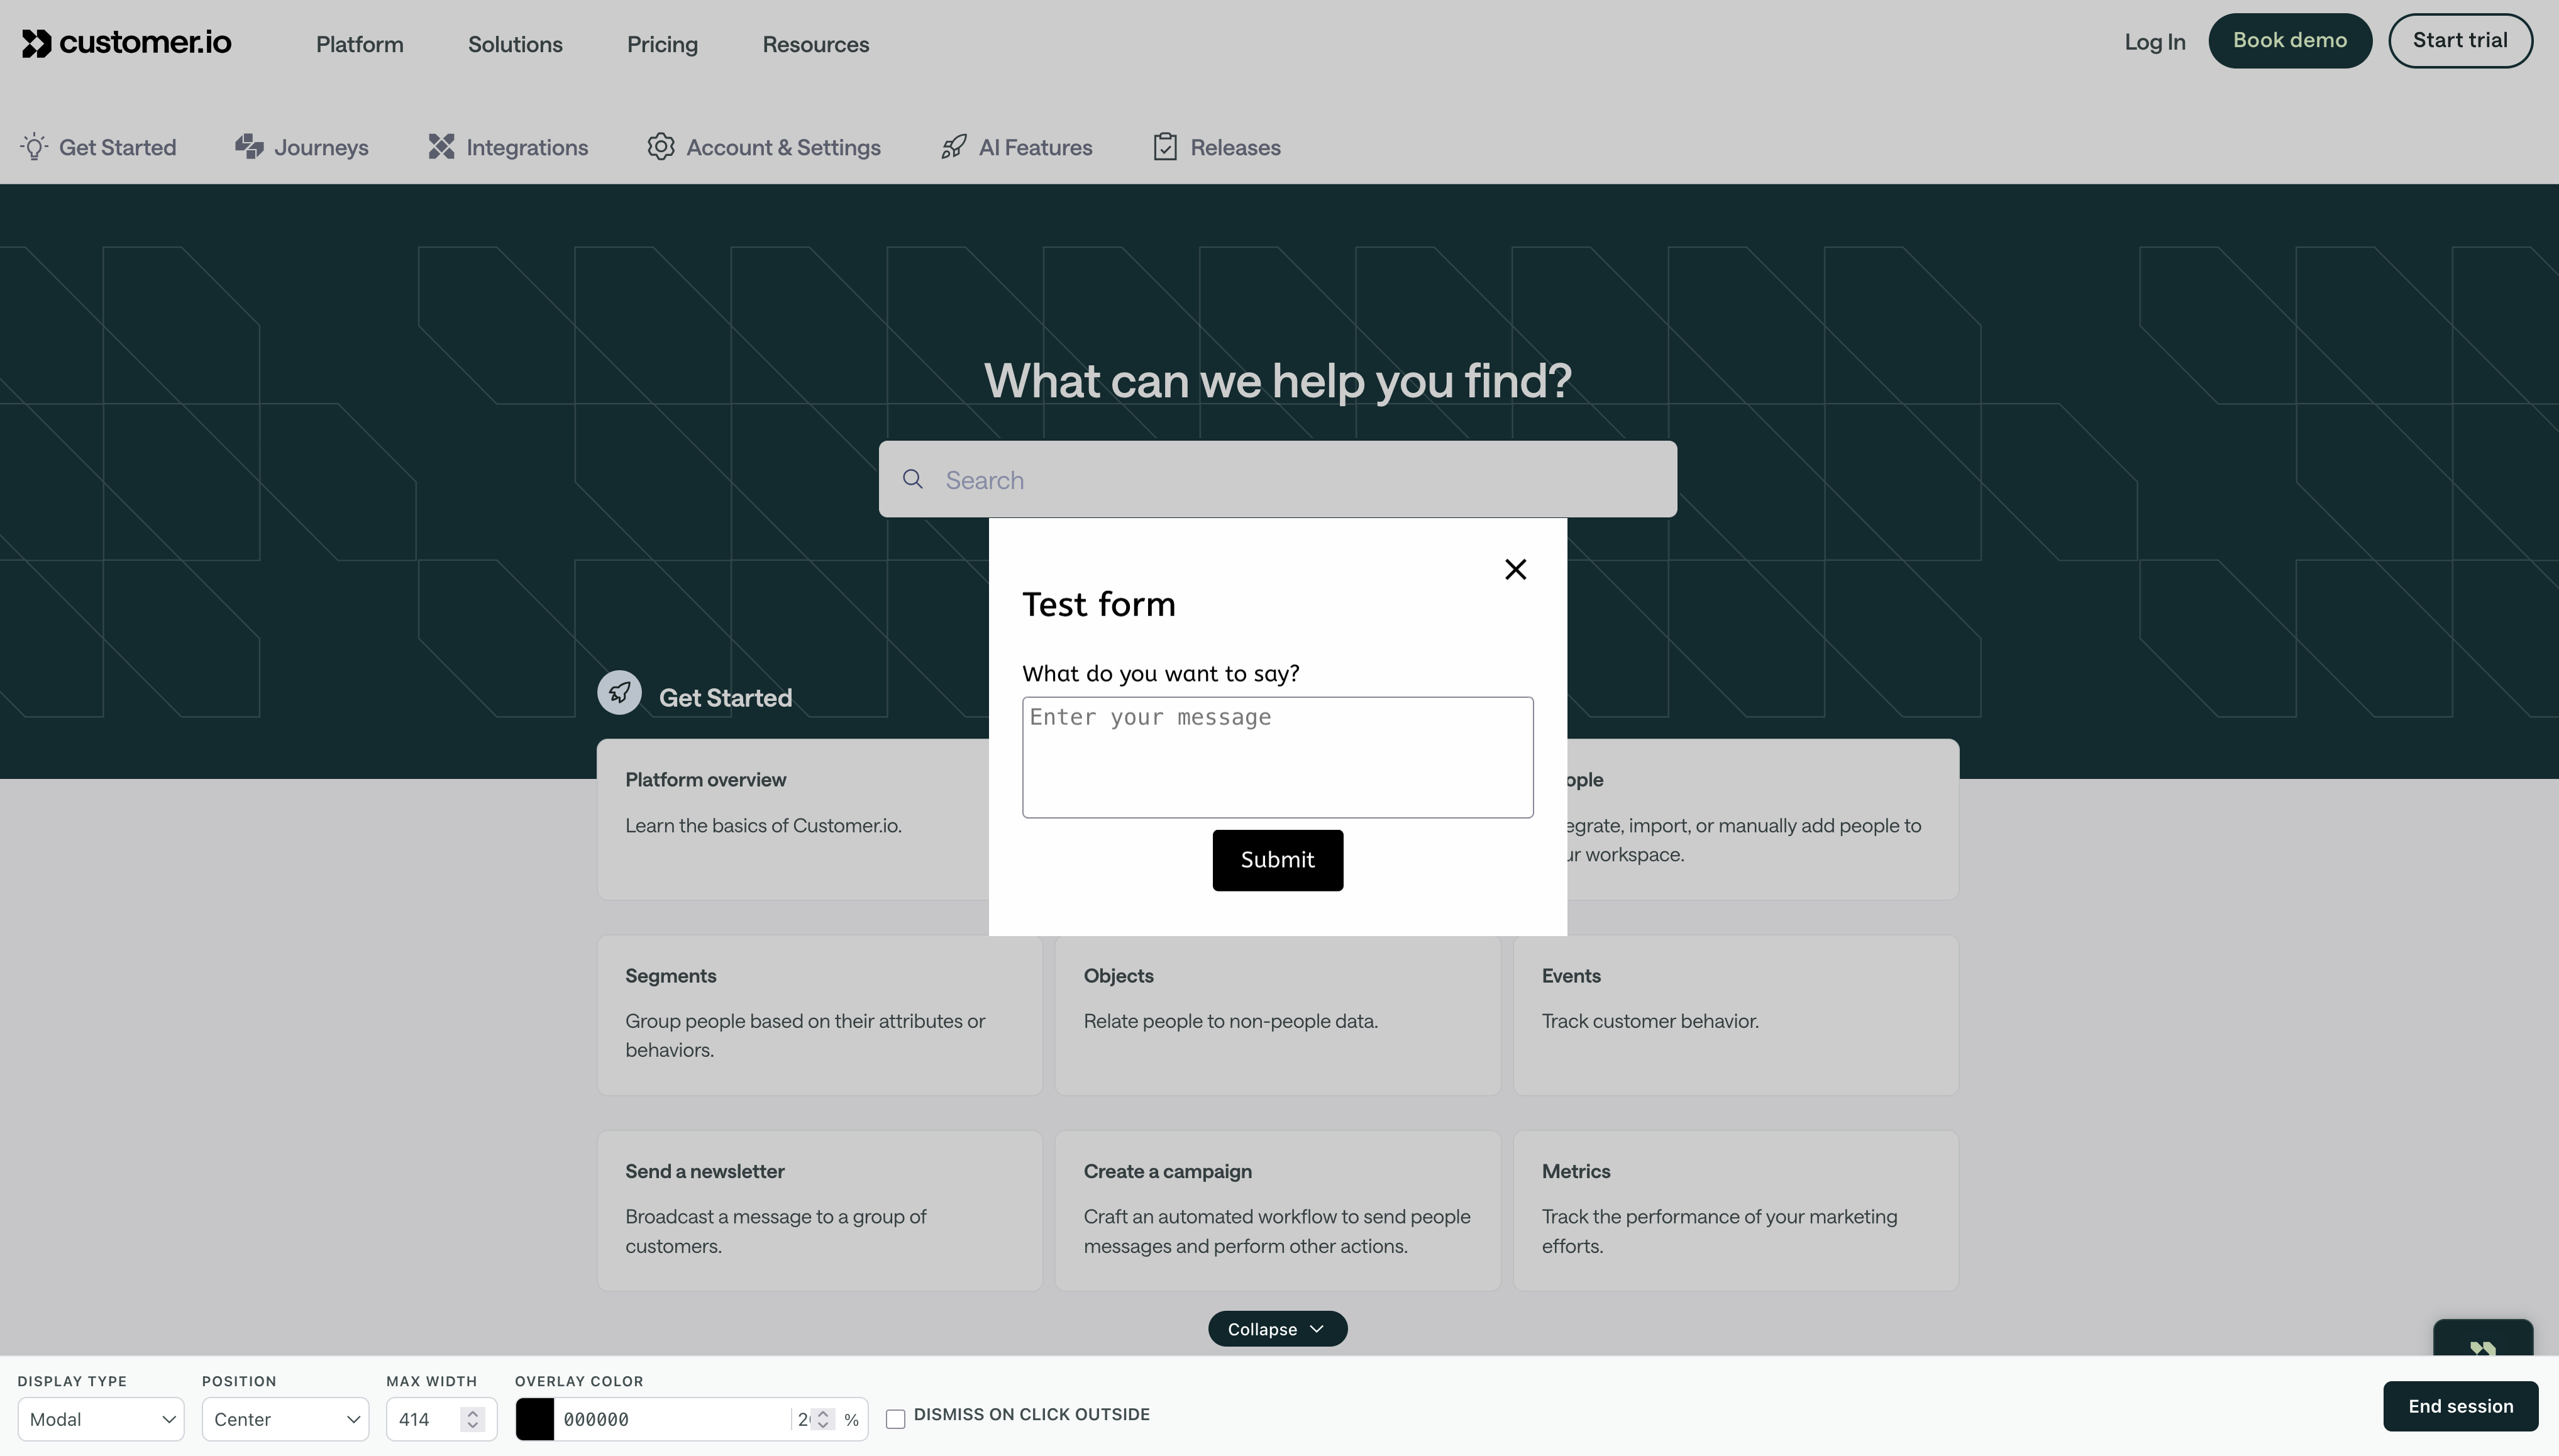
Live preview lets you see your in-app message on your actual website as you build it. Unlike Send Test, which sends a one-time test message, live preview opens your website in a new window. You can adjust display settings—like position, display type, and max width—directly on your website and see your changes reflected in the editor in real time.
This is a great way to make sure that your message looks and behaves the way you want it to before you send it to your audience.
To start a live preview session:
(Optional) In your in-app message, select a person you want to preview your message for. This populates the preview message, so you can test liquidA syntax that supports variables, letting you personalize messages for your audience. For example, if you want to reference a person’s first name, you might use the variable
{{customer.first_name}}. in your message.Click Live Preview.
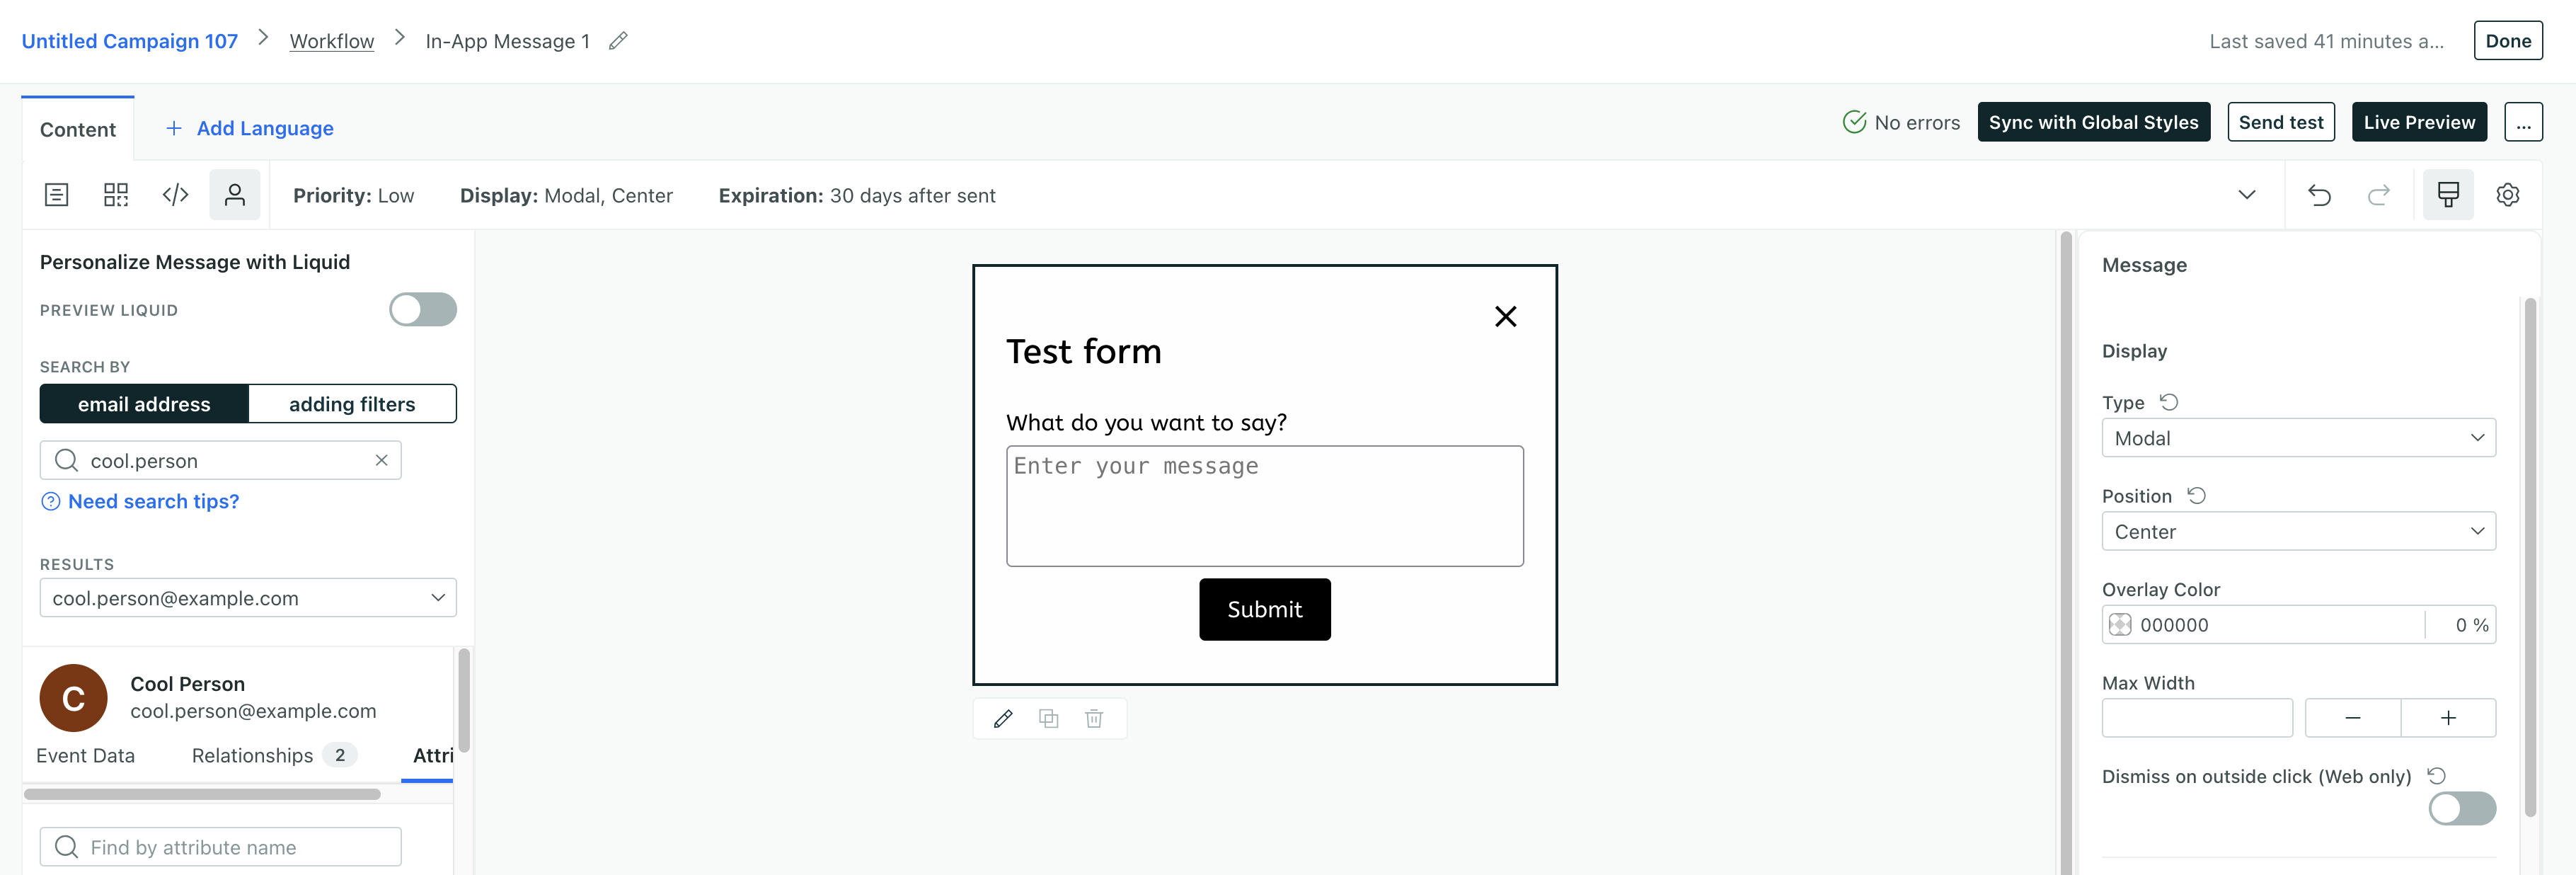
Enter the URL of the page on your website where you want to preview the message.
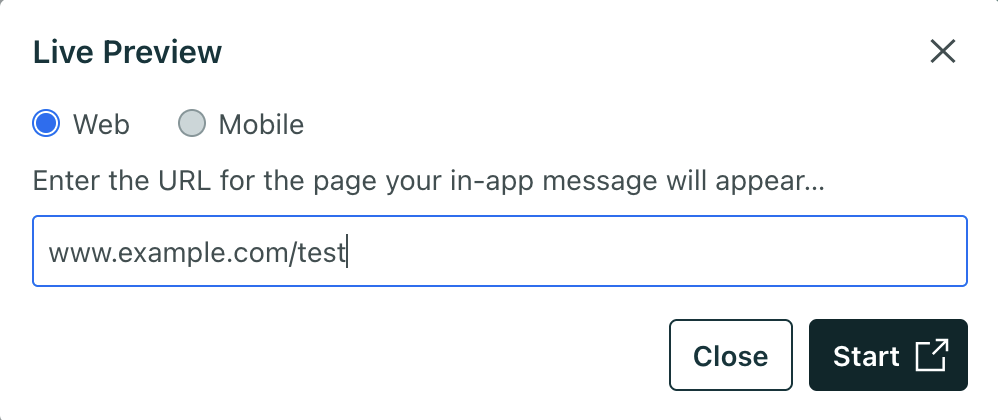
Click Start. Your website opens in a new browser window with a preview bar at the bottom.
Use the preview bar to adjust display settings. Changes you make in the preview bar sync back to the editor automatically.
For tooltip messages, your tooltip won’t appear unless you’ve already selected a target element. If you haven’t selected a target yet, click Select Element in the preview bar and click the element you want to anchor the tooltip. This automatically generates the CSS selector for you.
Return to Customer.io and click End Preview to end your preview session when you’re done.
Preview sessions last up to 30 minutes
Send a test message from an automation or broadcast
In an automation or a broadcast workflow, you can click Send Test to test a real message. This lets you make sure that your message behaves the way you expect: it shows up on the right page or screen; it appears in the right place on a page or screen; and the content all renders as you expect it to.
It may take a few minutes to see your first test message
Click Send Test.
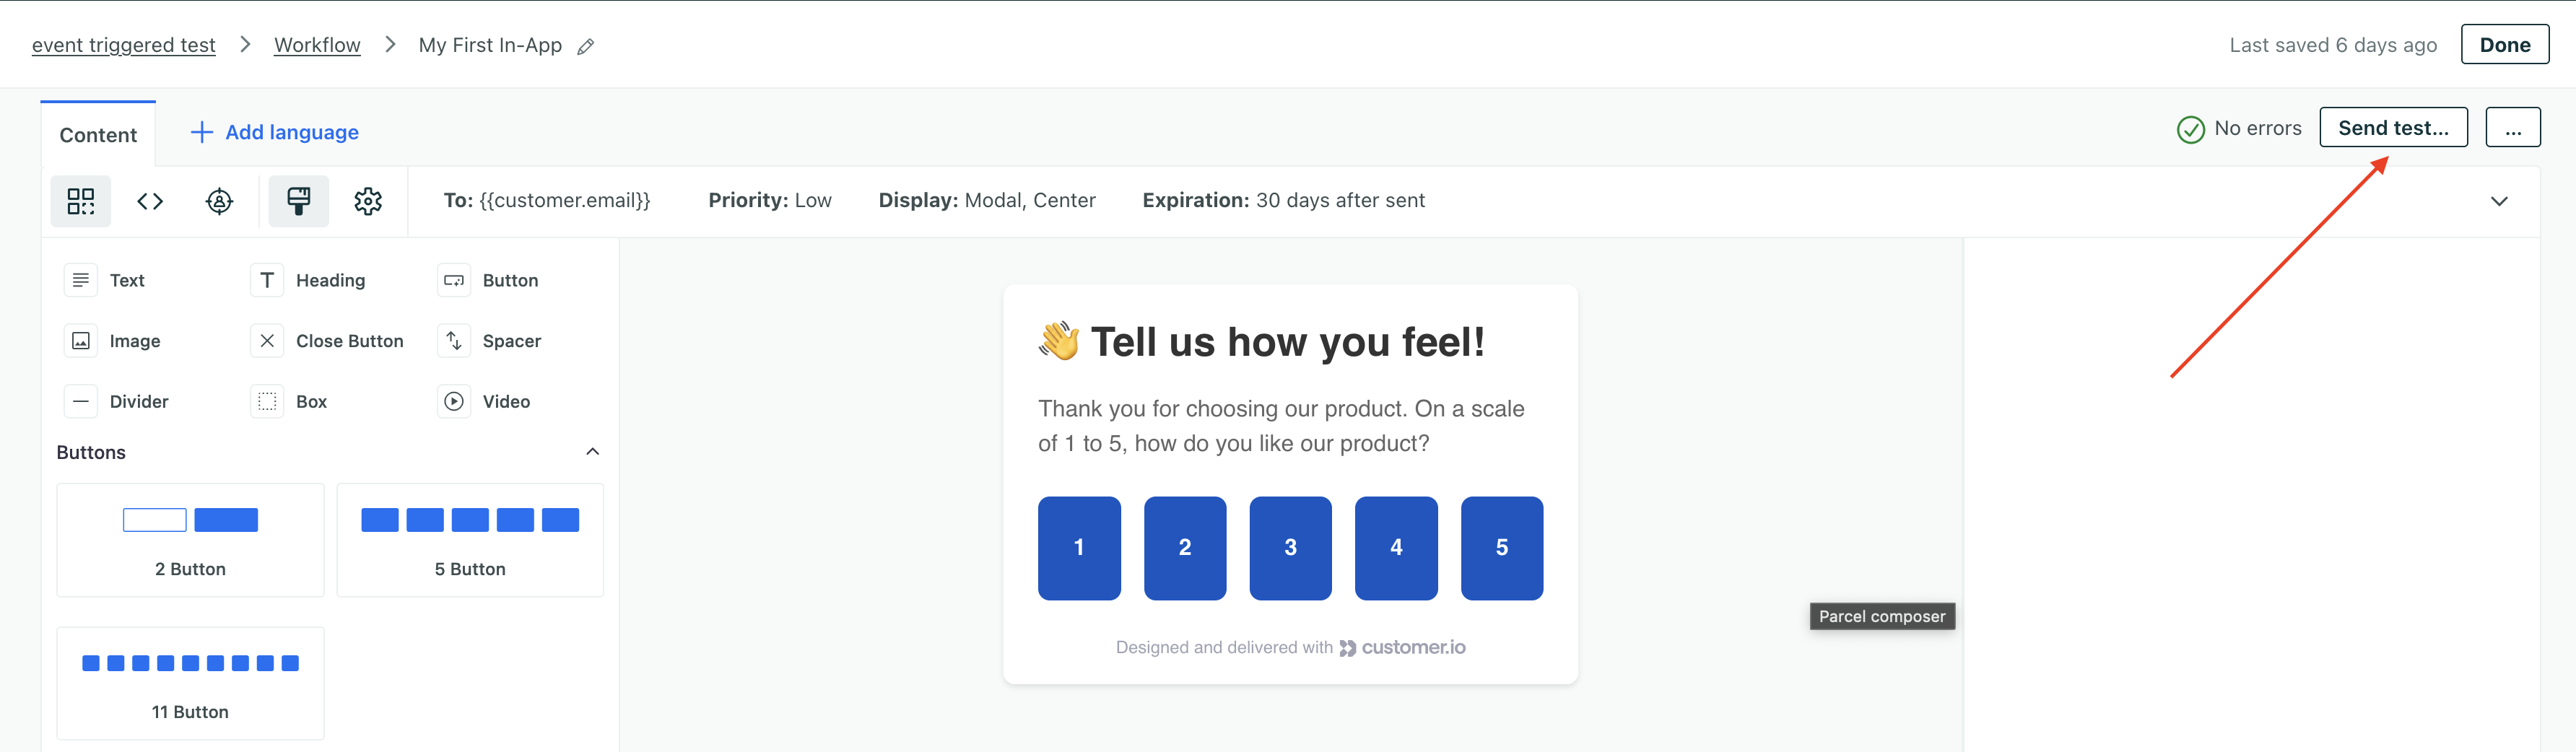
Enter the email or ID of the person you want to send your test to and click Send Test one more time.
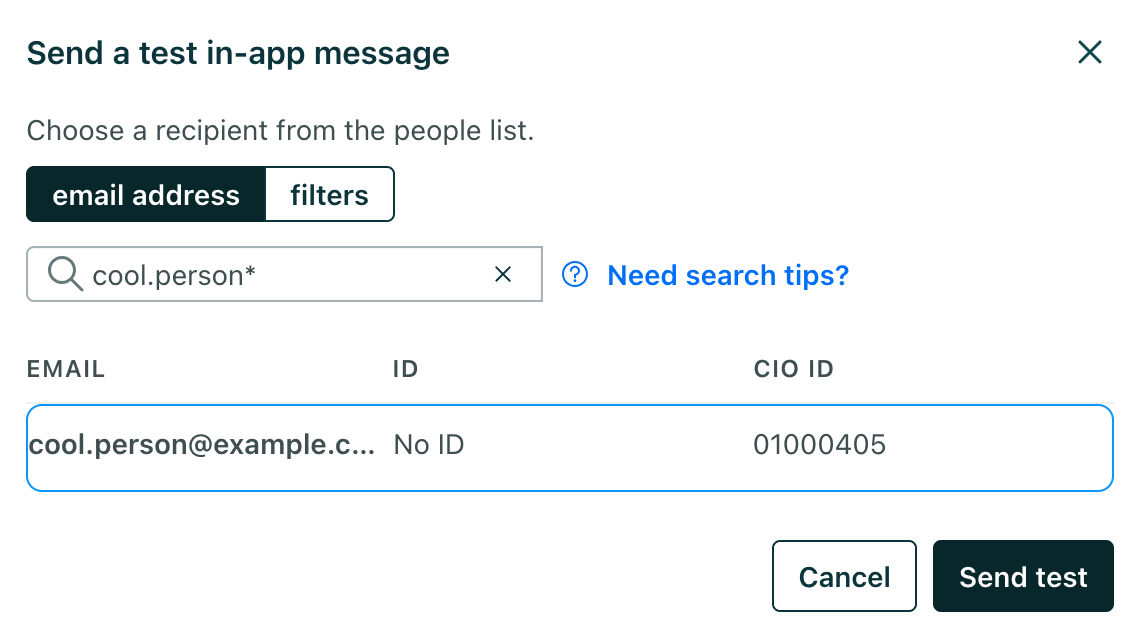
Open the app or website where you expect the test to appear and verify that your message works the way you expect it to.
If the message includes redacted data (that is, an admin has hidden sensitive attribute values from you), then test sends will not show the values for those sensitive attributes.
Test sends create real form submissions
Test your page rules
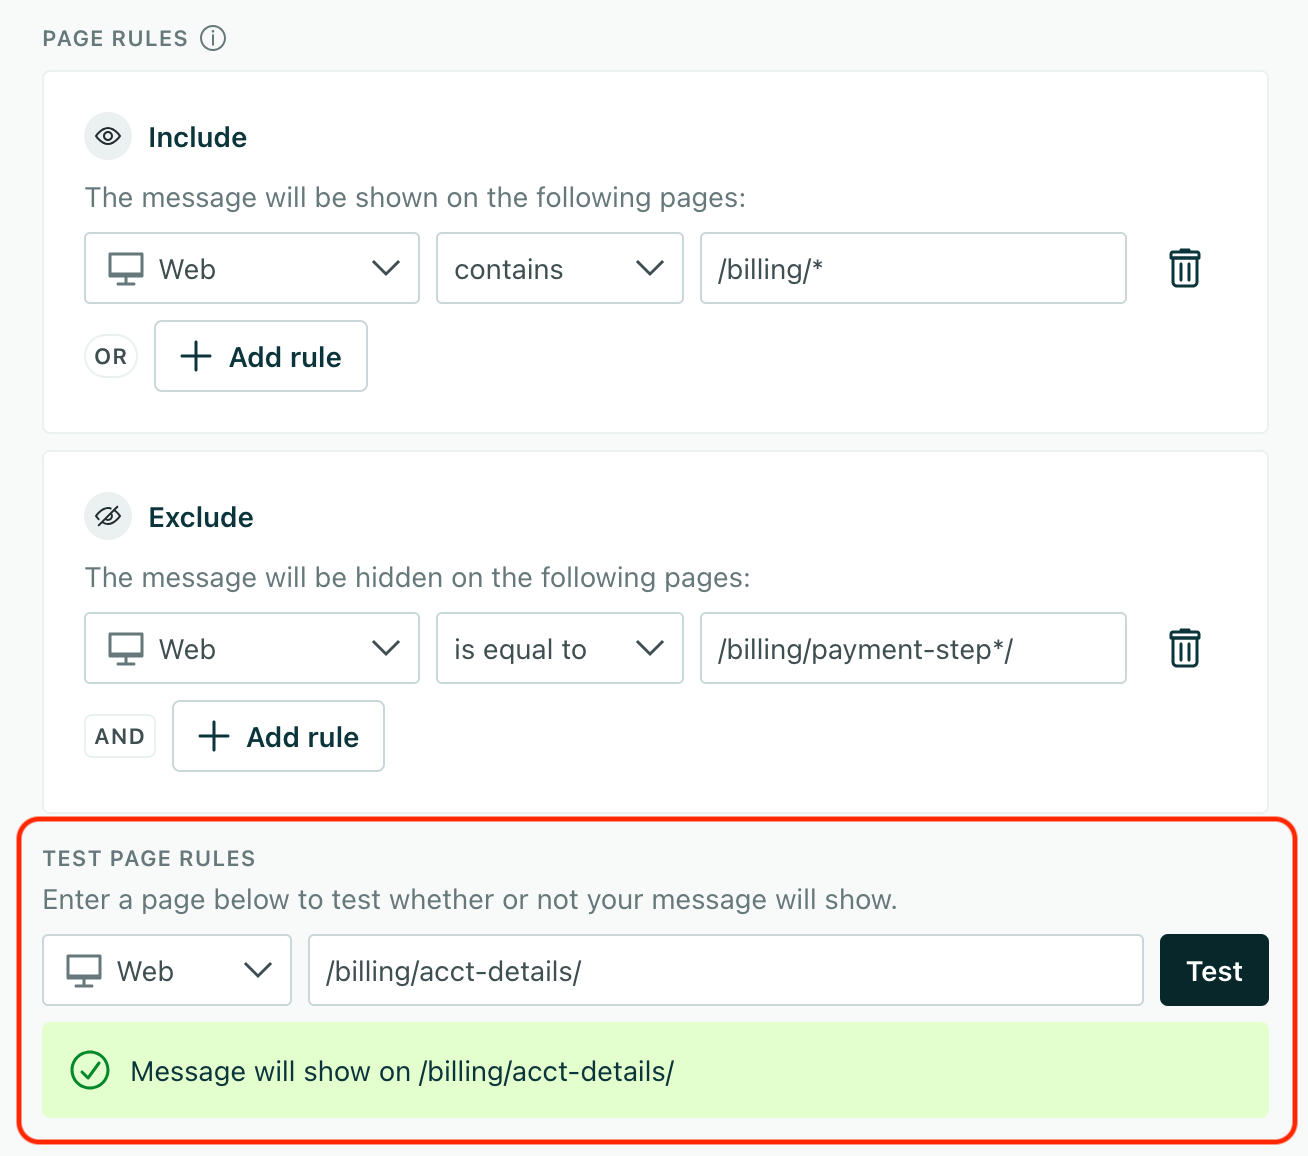
Page rules may contain regular expressions, and the rules along which we evaluate them can be hard to understand. That’s why we have the Test Page Rules section below the page rule editor.
Here you can enter a URL or page path and see whether your message will appear or not. Use tests to fine-tune your page rules and make sure that your message appears on the right pages before you send it.
Debug web in-app messages
The in-app SDK debugger helps you troubleshoot issues preventing your message from appearing when and where you want it to by showing what’s happening from the SDK’s point of view. It’s an overlay that runs on your website and shows you the SDK’s current state in real time: the workspace credential it’s using, the person it has identified, the route it thinks you’re on, and every message that’s currently active or waiting in the queue.
The debugger can help you catch common issues like:
- Wrong workspace: the Site ID doesn’t match the workspace you sent the message from.
- SDK not running: if the Config section shows NOT INITIALIZED, the SDK didn’t initialize correctly.
- Person not identified: if the User section shows (none), the person isn’t identified, so personalized messages won’t display. (This is normal and expected for anonymous in-app messages.)
- Route rule mismatch: if a message is queued with a ✕ on its route rule, the page rule doesn’t match the current route. This might happen if
cioanalytics.page()(a page call) isn’t sent on route changes in your single-page app. - Missing target element: if an inline or tooltip message is queued with a ✕ on its target, the CSS selector doesn’t match an element on the page.
The debugger is for web in-app messages only
debug so you can trace every aspect of your message, from receipt to dismissal.Turn on the debugger
The debugger is built into the JavaScript SDK. Add cio_debug_session=true to the URL of any page on your site containing the SDK and reload the page to turn on the debugger.
For example:
https://www.example.com/pricing?cio_debug_session=true
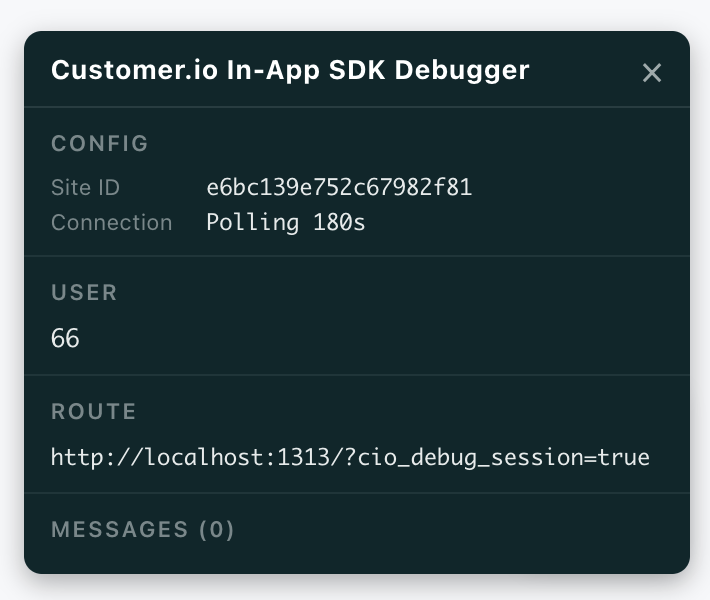
When the page loads, the Customer.io In-App SDK Debugger appears in the bottom right. It updates automatically as the SDK’s state changes—when the route changes, when a message displays or is dismissed, or when the inbox updates.
To close the debugger, click the × in the top-right corner of the overlay, or reload the page without the cio_debug_session parameter.
The debugger reflects the real state of the SDK on the current page—it doesn’t change how messages are delivered or displayed. It’s safe to use on a live site, but because it relies on a URL parameter, only people who know to add it will see it.
What the debugger shows
The overlay is organized into sections: Config, User, Route, and Messages. Together they tell you whether the SDK is set up correctly and, if a message isn’t showing, where the problem is.
Config
The Config section confirms that the SDK initialized and how it receives messages:
- Site ID: The site ID the SDK is using to connect to Customer.io. Confirm this matches the workspace you’re sending from.
- Connection: How the SDK receives messages. SSE means it’s using a real-time server-sent events connection. A value like Polling 30s means it checks for new messages on an interval instead. Polling is typically used when you haven’t sent messages yet or recently; when you start sending messages the SDK switches to SSE.
If this section shows that the SDK isn’t initialized, see Set up your website to check your installation.
User
The User section shows the person the SDK has identified on the current page:
- A user token (truncated) means a person is identified. This is the value you passed to
cioanalytics.identify(). - (anonymous) means the SDK is using an
anonymousIdtoken—the person isn’t identified, so they can only receive anonymous in-app messages. - (none) means there’s no
userIdoranonymousId. This might indicate a problem with initialization.
Route
The Route section shows the current route the SDK is using to match against your messages’ page rules.
If the route shows NONE, the SDK doesn’t know what page you’re on, so it can’t match page rules. In a single-page app, this usually means analytics.page() (a page call) isn’t being sent on route changes. The SDK only sends page calls automatically on a full page load, so your single-page app must send a page call manually on route change to tell the SDK where the user is.
Messages
The Messages section lists every message the SDK currently knows about, with a count in the heading. Each message is tagged with its display type (such as modal, overlay, or inline) and a state:
- active—the message is currently eligible to display (or is displayed) on the page.
- queued—the message is held and not displayed yet. The debugger shows why.
Each message also lists relevant properties depending on its display type—its Route Rule, Position, Target (the CSS selector for an inline or tooltip message), or Tooltip position. Where it can, the debugger validates these and flags problems:
| Indicator | Meaning |
|---|---|
| ✓ next to a property | The condition is satisfied (for example, the route rule matches, or the target element exists on the page). |
| ✕ next to a Route Rule | The message’s route rule doesn’t match the current route, so the message won’t display here. If it should, verify the route is set correctly and that analytics.page() is called on route changes. |
| ✕ next to a Target | The target element wasn’t found on the page. If it should be there, verify the CSS selector is correct. |
You can dismiss an active message directly from the debugger by clicking the × on the message. This can help if you want to trigger a message again or test dismissal behavior without reloading the page.
Troubleshooting tips for your in-app integration
Close your browser or app before you send your first test. Before you send your very first message, we poll for messages at a slow rate. We update this rate when you send your first message—but only if your browser or app is closed. If you have your app or website open when you send your first message, it may take up to 3 minutes to see your message. This delay only occurs for the very first message you send from Customer.io. If you’ve already sent your first test with the app or browser open, clear your cache or restart your app to actively poll for messages.
If you send a test message and don’t receive it:
- Check that you sent your test to the correct user.
- Make sure that you’ve identified the profile you want to send your test to. On the web, the debugger’s User section tells you at a glance whether a profile is identified. You can also send a manual identify call in the console—if the message shows up afterward, the problem is likely in how your code sends identify calls:
cioanalytics.identify(<id or email>) - Check your browser console for errors. You can trace traffic to and from Customer.io to find the problem. On your website, you should see calls for
i(identify) andp(page) before you get your message. - If you have a single page app, make sure that you’ve set up page calls correctly. We only send page calls automatically when a page loads, which won’t happen on route changes in a single-page app—so you’ll need to send page calls manually when the route changes. The debugger’s Route section shows you the route the SDK currently knows about.