Workspace Performance dashboard
UpdatedYour Workspace Performance dashboard helps you monitor workspace health, data processing, and messaging performance. It’s the first place to go when troubleshooting delays or checking on the status of your workspace.
Click > Workspace performance to go to your dashboard.
Start troubleshooting
To start troubleshooting, review your Active issues on the Overview tab and dive into data or messaging metrics. Data metrics showcase info for data coming into your workspace. Messaging metrics showcase data for messages leaving your workspace.
- Check your Overview tab for Active issues.
- Review your daily metrics on the Data tab to help diagnose data ingress issues.
- Review your daily metrics on the Messaging tab to help diagnose messaging output and delivery issues.
Health status
Your dashboard shows the relative health of your workspace with a status indicator:
- Healthy—workspace is healthy and operating normally.
- Busy—Your workspace is processing a higher volume of events than normal. There may be delays in processing activities and sending messages.
- Slow performance—Your workspace is experiencing degraded performance. There are major delays in processing and at least one error that needs your attention.
If the status shows a problem, check out Active issues on the Overview tab to learn more.
Suggested optimizations
Your dashboard surfaces recommendations to improve performance across your workspace. These suggestions help you reduce processing delays and keep your workspace running efficiently before issues pop up. Common recommendations include:
- Archive unused segments.
- Review campaigns with no recent sends. They may be candidates for pausing or archiving.
- Throttle incoming data if your workspace is processing a high volume.
Act on these suggestions proactively to prevent performance issues from impacting your data and deliveries. Click Optimize with agent to open the Agent and get started.
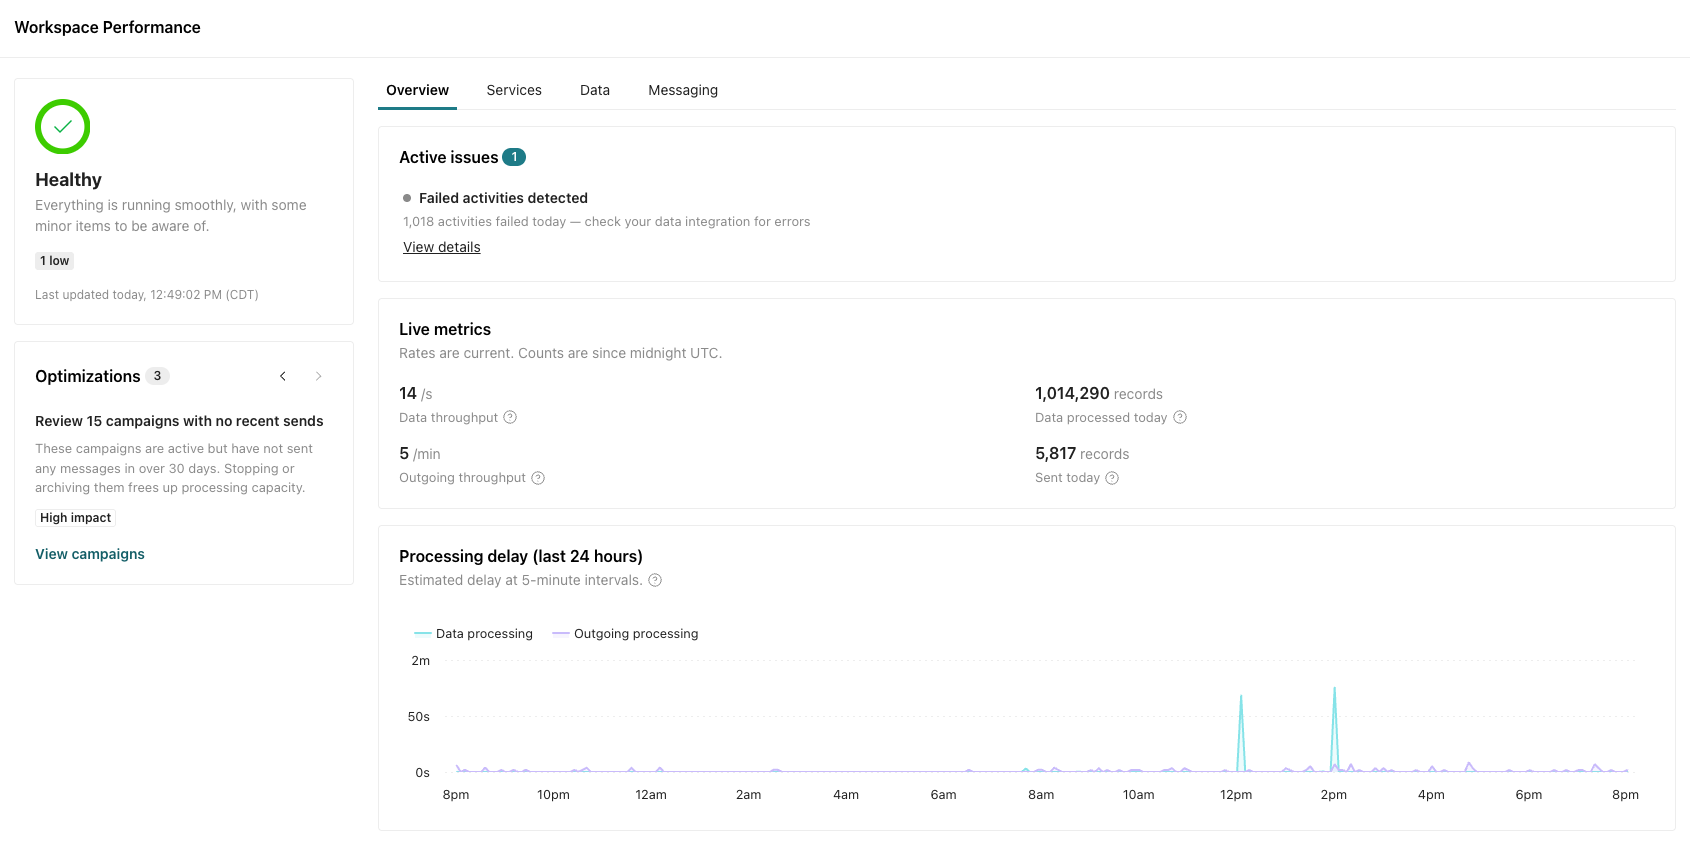
Overview
The Overview tab gives you a snapshot of your workspace’s current performance. It’s the best starting point when you need to quickly understand what needs your attention.
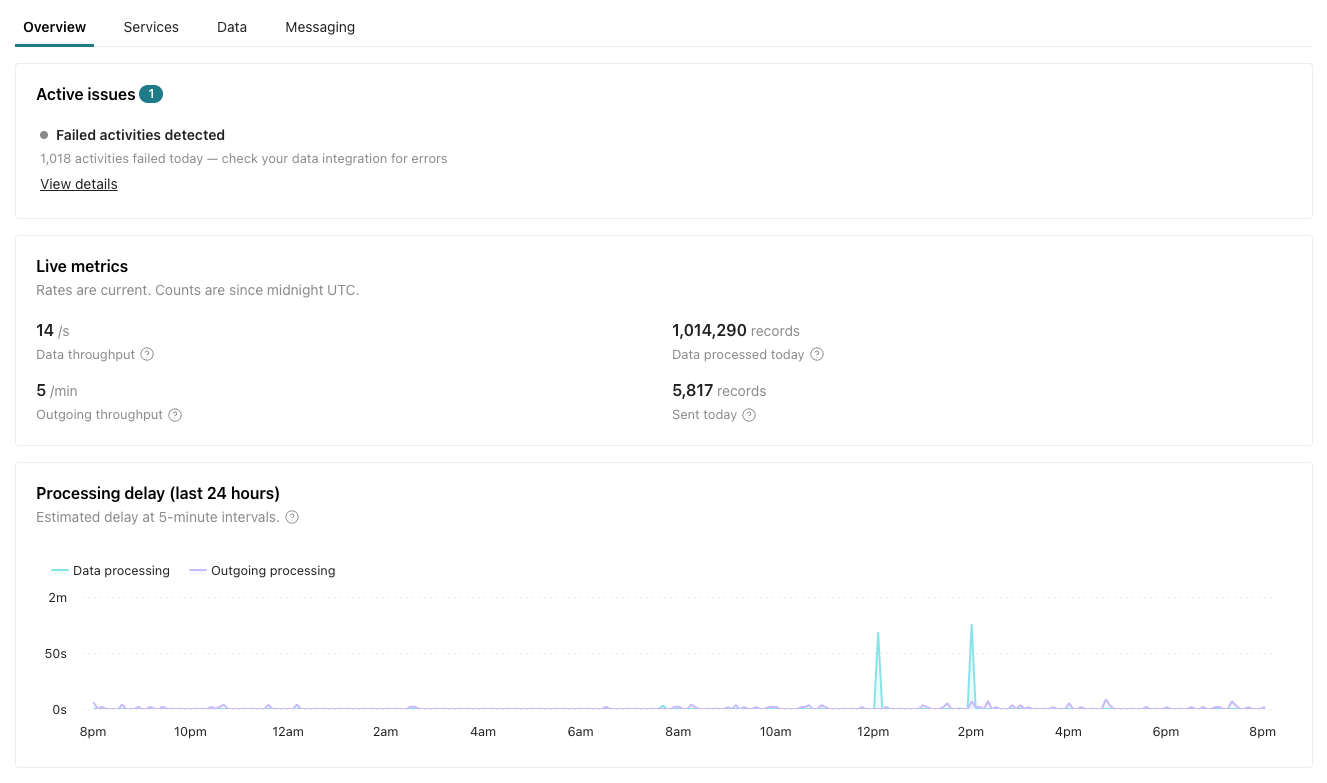
Active issues lists problems affecting your workspace. Click an issue to learn more about it.
Live metrics gives you insight into the current day’s incoming data, outgoing messages, and the speed of processing. Hover over to learn more about each metric.
Processing delay shows you the last 24 hours of processing delays for ingress and egress queues—data processing and outgoing messages respectively.
Services
The Services tab breaks down the status of individual services that power your workspace. It captures processing of data coming into your workspace and messages going out.
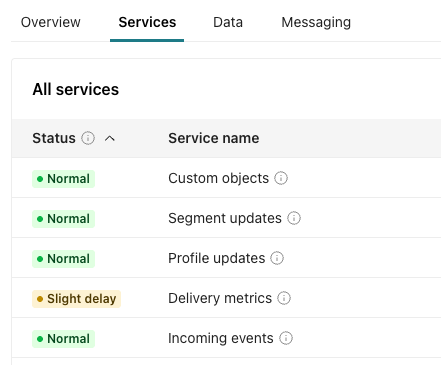
Review them to determine which service is affected when the health status shows a problem. Hover over to learn more about each service.
There are four possible statuses for each service:
- Normal—The service has no backlog and any delay is under 10 seconds.
- Slight delay—The service is delayed between 10 to 60 seconds.
- Delayed—The service is delayed 1 to 5 minutes.
- Major delay—The service is delayed over 5 minutes.
Data
The Data tab helps you understand how your workspace processes incoming data.
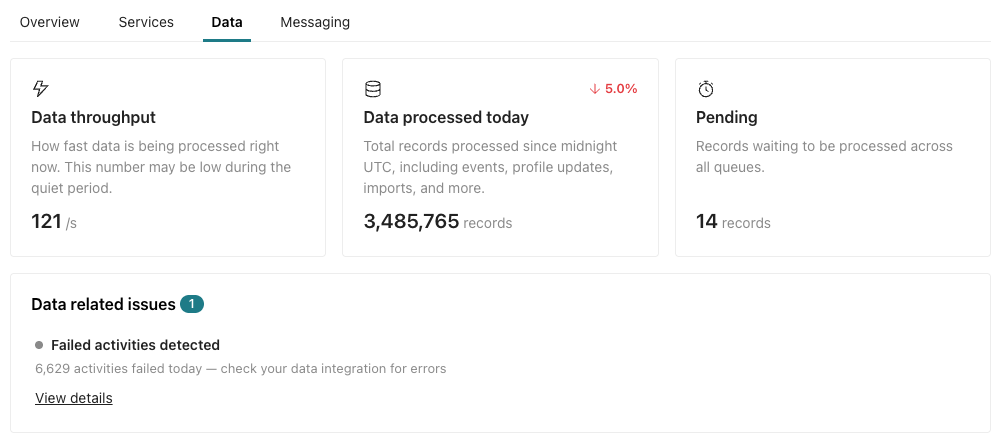
Data throughput shows your current processing speed.
Data processed today compares today’s data volume against yesterday’s so you can quickly spot unusual patterns.
Pending signals whether there’s a backlog of data waiting to be processed.
Data related issues raises any issues that should be addressed by your team.
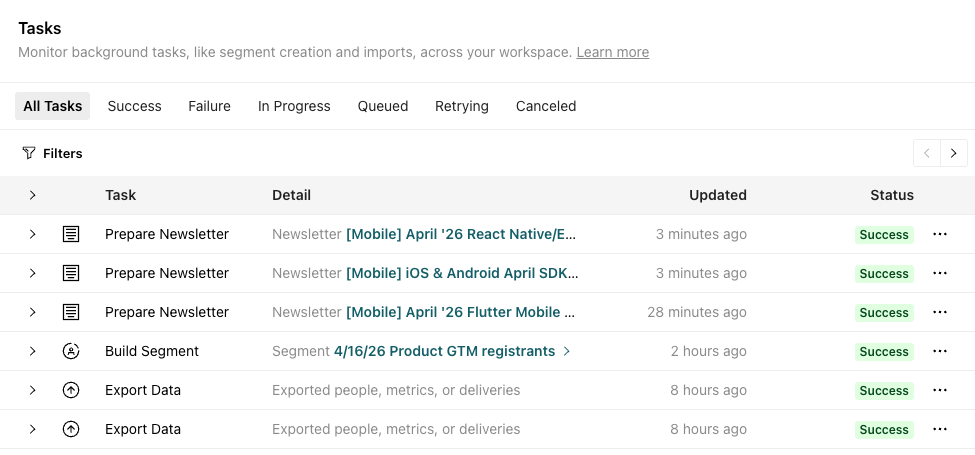
Tasks
The Tasks section helps you monitor background tasks that might take some time to complete, like segment creation and imports. This is the same as the Tasks page; go to those docs to learn more about task types and priority levels.
Data Index overview
Within the Data tab, you can see a glimpse of the quantity of attributes, events, and custom objects in your workspace, which can help signal whether it’s time to audit your data. Attributes only surface customer attributes, not those for events, objects, or relationships.
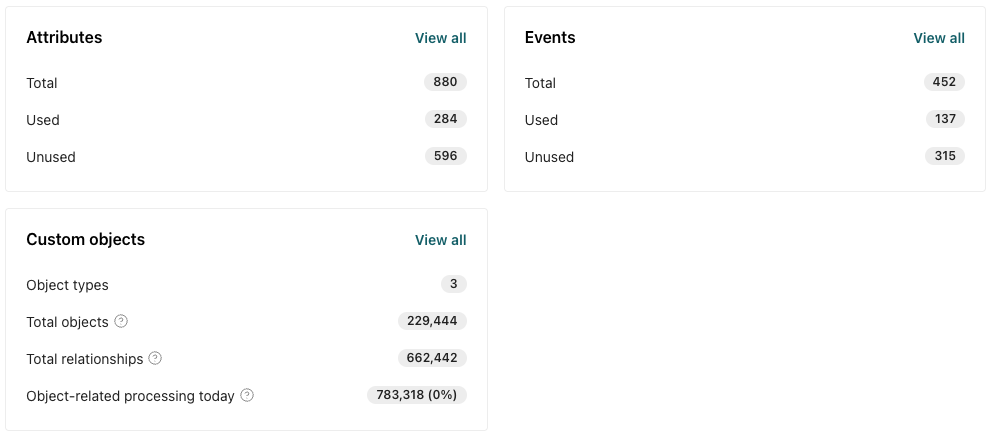
Here are a few ways you could think about this data:
- Consider reviewing and/or removing attributes that are unused.
- Consider consolidating duplicate attributes.
- If you have unused events, consider reviewing your integrations and determining if you actually need to store these events in your workspace.
- Objects count towards billing. If the count seems high, check for objects with no relationships to people. This could signal unused objects you could delete.
Click View all to go to your Data Index and learn more about attributes and events. From here, you can also filter for object and relationship attributes to see where they’re used.
Messaging
The Messaging tab tracks the status of message sending. It’s useful for troubleshooting message delays or verifying that campaigns are sending as expected.
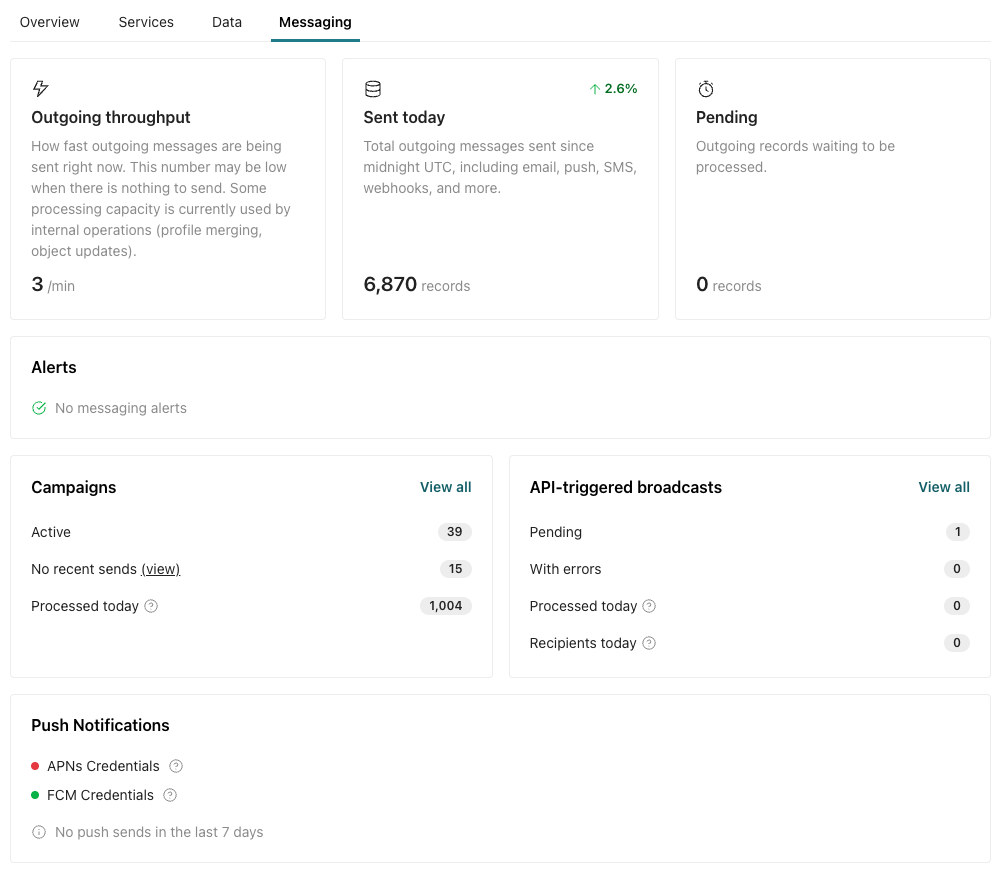
Outgoing throughput shows the current rate of messages leaving your workspace. Use this to verify that messages are flowing. If throughput drops unexpectedly, check Alerts for more information.
Sent today shows the total messages sent today across all channels, excluding anonymous messages. Compare this against your previous day’s volume by hovering over the percentage. A sudden drop will help you spot a problem.
Alerts tell you when workflows or message channels experience delays. Check the affected workflow or channel to identify whether high volume, a service issue, or a configuration problem is the cause.
Towards the bottom are workflows and channel specific information:
- Campaigns shows you at a glance whether campaigns are being processed—that is, the number of workflow steps like a journey start, webhook action, etc that your workspace has processed.
- API-triggered broadcasts shows you whether API-triggered broadcasts are being processed. Pending means your workspace is evaluating recipients and queuing messages. With errors indicates you should take a closer look at your workflow.
- Push notifications shows you whether this message type is configured. Hover over to learn more.